
You can have cash in the bank and still lose leverage overnight. Here is the mechanism most teams miss.
Many companies that monitor their finances closely focus on the wrong deadline.
They know their cash runway, track their burn rate every week, and can tell you exactly how many months until their cash runs out.
But they often can’t tell you about another important deadline: The one they’re already tracking without realizing it.
That’s the date you could breach your loan covenant.
What brings that date closer is something inside your own operations, often hiding in plain sight.
The connection most teams miss
Covenants show up in bank loans, venture debt, revenue-based financing, and sometimes in shareholder agreements. If you’ve borrowed money with a leverage condition, you have a breach date, even if you haven’t worked it out yet.
The leverage ratio is straightforward: net debt divided by EBITDA. If that ratio fails on the test date, everything changes right away. It doesn’t wait until your cash runs out or you miss payroll.
Most founders and boards get this in theory. What they often miss is how working capital quietly reduces the time they have.
It’s not that working capital changes the covenant itself, but it affects how fast you can pay down debt or avoid borrowing more.
Here’s how it works:
Your cash conversion cycle is the number of days your cash is tied up in your operations, from inventory, to receivables, to paying suppliers.
Cash stuck in receivables and inventory isn’t available to pay down debt. So even if your revenue is steady, your financial cushion can shrink because your operations are using up cash that could give you more time.
I’ve seen this happen in nearly every restructuring I’ve worked on over the past 30 years. It rarely makes it onto the board’s agenda until it’s too late to do anything about it.
What the numbers show
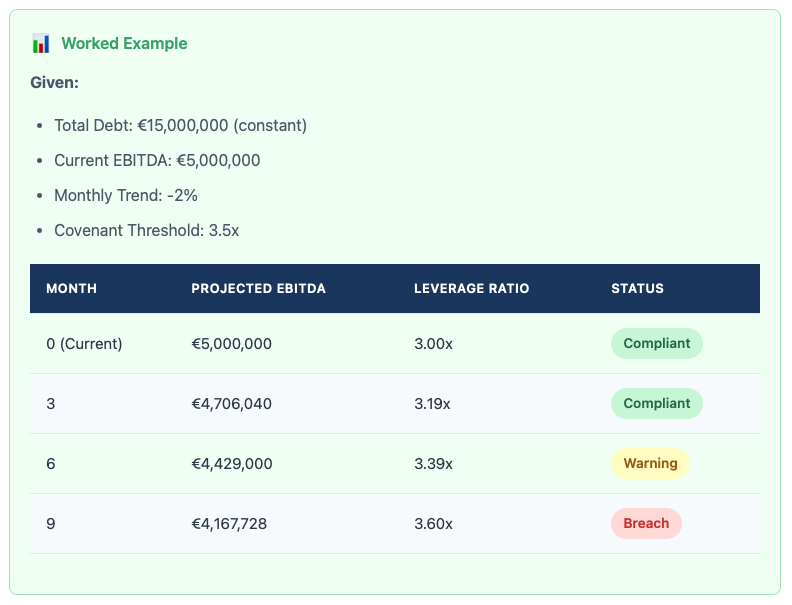
Let’s look at two companies that look identical on a board presentation.
Both have €15M in debt, generate €5M in annual EBITDA, run a -2% monthly EBITDA trend, have a 3.5x leverage covenant, and €20M in annual revenue.
The only thing that sets them apart is how they manage working capital.
Company A has a 45-day cash conversion cycle. With €20M in annual revenue, that means about €2.47M in working capital is tied up.
Company B’s cash conversion cycle is only 20 days, so just €1.10M is tied up.
That’s a €1.37M difference in liquidity.
Now, let’s see what that means in terms of time.
If you treat that €1.37M as extra capacity to pay down debt, Company B’s net debt drops faster, so its leverage ratio stays under the covenant limit for longer.
If you run the same debt, EBITDA, covenant, and downside trend through the Covenant Horizon Calculator, you get two different breach dates:
Company A breaches in 33 weeks.
Company B breaches in 53 weeks.
That’s a difference of twenty weeks.
They may look the same on a board slide, but they’re very different when the lender checks the numbers.
The three dates with the missing piece
1) Cash zero date.
2) Covenant breach test date.
3) Funding close date.
The order of these dates shapes your negotiating position.
What most teams miss is that their breach date is being set right now by everyday operational decisions. How you handle receivables is a covenant decision.
Your inventory policy is also a covenant decision. The terms you set with suppliers are a covenant decision, too.
Every extra day you wait to collect cash could mean losing valuable headroom.
The tool
Most runway calculators only go as far as cash zero, and most covenant models are hidden in private spreadsheets. This tool brings both deadlines together in one place.
I’ve built a free Covenant Horizon Calculator at covenanthorizon.earlywarningindex.com.
Just enter a few numbers, and you’ll get:
Your projected breach test date
Headroom in weeks
A four-band severity rating
Cash runway date
Funding close comparison
Optional cash conversion cycle impact, including what a 10-day improvement buys back
It also ranks the actions that can improve your position, showing how many weeks of headroom each one adds. Debt reduction, EBITDA improvement, covenant renegotiation, and working capital optimization are all ranked by real impact, not just what seems reasonable.
Covenant risk bands
You can generate a board memo in just two clicks. The tool runs entirely in your browser, with no login and no data leaving your device. It works for any debt with a leverage condition, whether it’s a bank loan, venture debt, or revenue-based financing.
Who this is for
This is for founders with venture debt, revenue-based financing, or any loan with covenants. It is also for CFOs and finance leads heading into lender calls or board meetings.
If you are an interim or fractional exec helping a company under pressure, it is built for that reality, too.
And if you sit on the investor or board side and need to stress-test covenant risk before a funding round, you will quickly reach the answer.
If you are dealing with covenants for the first time, every input has a plain language explanation.
Try it
covenanthorizon.earlywarningindex.com
It’s free, takes just a few minutes, and nothing leaves your browser.
If you want a custom analysis, there’s an optional form after you get your results. Or you can message me directly, and I’ll give you a clear explanation of what your numbers mean.
Your breach date is already set.
The real question is whether you’ll know it before your lender does.