
The Risk Communication Score - Why your board presentation gets you interrogated and how to stop it.
If your board meeting turns into an interrogation, it is usually your risk communication failing, not your numbers. This newsletter explains why it happens and how the Board Ready Risk Communication Score pinpoints what to fix before the next board deck.

30 hours. Three questions.
As CEO, I walked in well prepared, or so I thought. 30 hours on the deck. Then the risk questions came, and I still remember them to this day:
What is our covenant headroom, and what triggers a breach?
What emerging risks are you seeing that are not on the risk register yet?
Which risks are genuinely strategic, and which are operational noise?
The room shifted. The meeting was cut short. They told me to come back better prepared for next week's new board meeting. I was embarrassed and frustrated to say the least.
When You Lose the Room.
I have watched this pattern for 30 years on both sides of the table. You walk into a board meeting with a slide that feels reasonable and prepared. Three boxes. Some text. A few mitigation bullets.
And then the meeting turns into an interrogation, because your slide forces them to do their job the hard way.
They spot gaps fast. So they start pulling the thread. And once they start, you lose the room.
You can feel the shift when it happens. Your “update” becomes a cross-examination. Your mitigation becomes “what have you actually done?” Your timeline becomes “based on what data.” Your confidence becomes “why did you not flag this earlier?”
Not more words, more slides, or more detail, but a more precise and accurate assessment of the situation, with something the board can act on immediately.
The Trap.
The challenge: Most risk slides fail because they are vague, optimistic, and undocumented.
The problem with that: It's just a list of undocumented worries, dressed up as governance to protect yourself.
Boards don't want dressed up reassurance. They want evidence they can act on. If you don't give it to them, they'll dig for it. That is why the questions are predictable. They are fiduciary.
And if you do not pre-answer them, a professional board will ask them anyway. That is your trap.
What I Wish Someone Had Told Me.
But here's what I wish someone had told me before that meeting: Board meetings shouldn't be interrogations. The best CEOs don't just answer questions—they bring questions to the board.
Examples:
"Given our runway, what's your risk tolerance on the next senior hire?"
"Who in your network has solved this exact problem before?"
"If we miss Q2, what's your real appetite for a bridge?"
Boards have decades of experience, networks, and pattern recognition. Most founders never ask them to use it.
If you only show up to defend, you train your board to act like prosecutors. If you show up with structure and specific asks, you turn the meeting into a working session.
The Tool.
As an entrepreneur, CEO, board member, and investor, I've seen this pattern too many times.
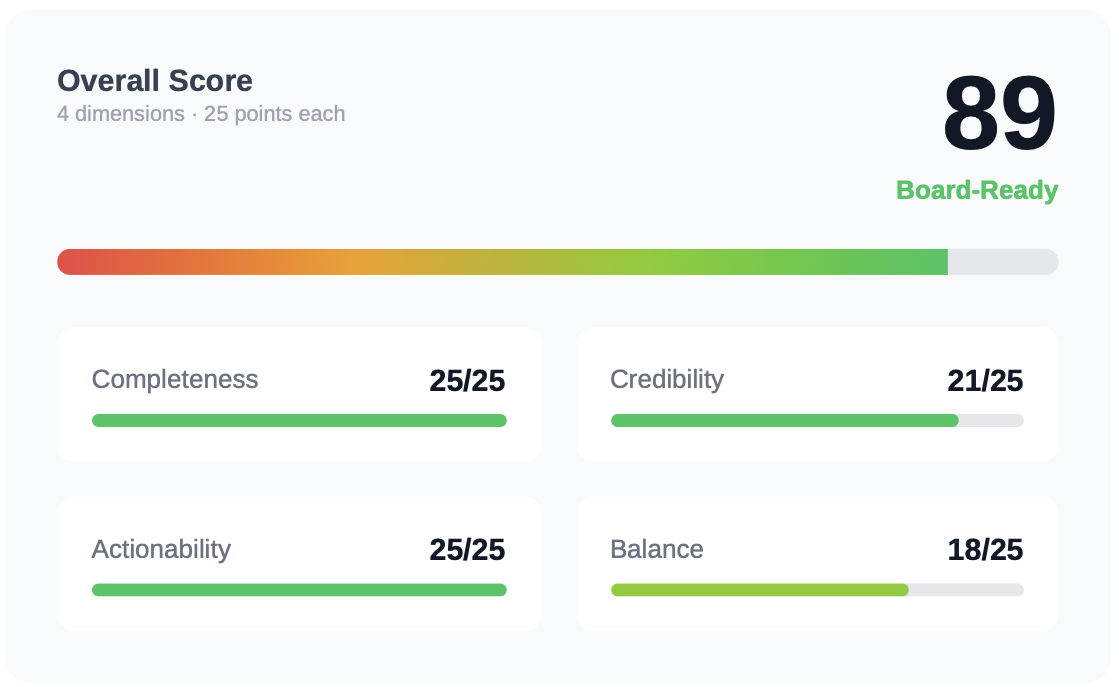
BoardReady gives you a Risk Communication Score from 0 to 100 with a breakdown across four dimensions: completeness, credibility, actionability, and balance.
It also predicts the board questions you are likely to get, with guidance on how to answer them. And it gives you strategic questions to ask your board, so you can leverage their expertise and network rather than treating them like a courtroom.
The tool takes your inputs and turns them into a board-ready slide you can download as a PDF or PowerPoint.
The Three Mistakes.
Most founders communicate risk by trying to perform calm. When the board pushes back, they hear it as criticism and start hiding. That's when trust dies.
That is when a bridge gets harder, not because of one missed KPI, but because trust in the update drops. Experienced board members will notice missing areas immediately.
And when they notice, they stop focusing on the rest of your slides.
BoardReady forces you to name categories, severity, timeframe, and confidence, so the slide has shape and the risks are comparable.
Another mistake is imbalance. Many teams present only the bad. Others present only “positives” and call it a balance. Boards want both because they are trying to judge signal versus noise.
BoardReady explicitly includes positive signals and what you have tried so that the board can see movement rather than theatre.
When Trust Breaks.
The language from boards and investors is always the same: 'I stopped trusting the updates.' I've heard the exact words for years. Investors call it 'the verification gap.' Fractional CFOs call it 'the train wreck.' Founders call it 'toxic positivity.' Different words, same problem: the board stopped trusting the update.
The fix is more straightforward than most think: credible risk communication.
Before Your Next Meeting.
Read your risk slide and ask yourself four questions.
Completeness: What obvious category did I avoid because it is uncomfortable?
Credibility: What statement would a board member challenge with “based on what?”
Actionability: Who is the owner, what is the next step, and what decision do I need from the board?
Balance: Did I show what is working, or did I create panic fuel?
Try It
That is the Risk Communication Score in human form.
Try it free: boardready.earlywarningindex.com
Or reply BOARDREADY, and I'll send you the link and a sample output so you can see the report.
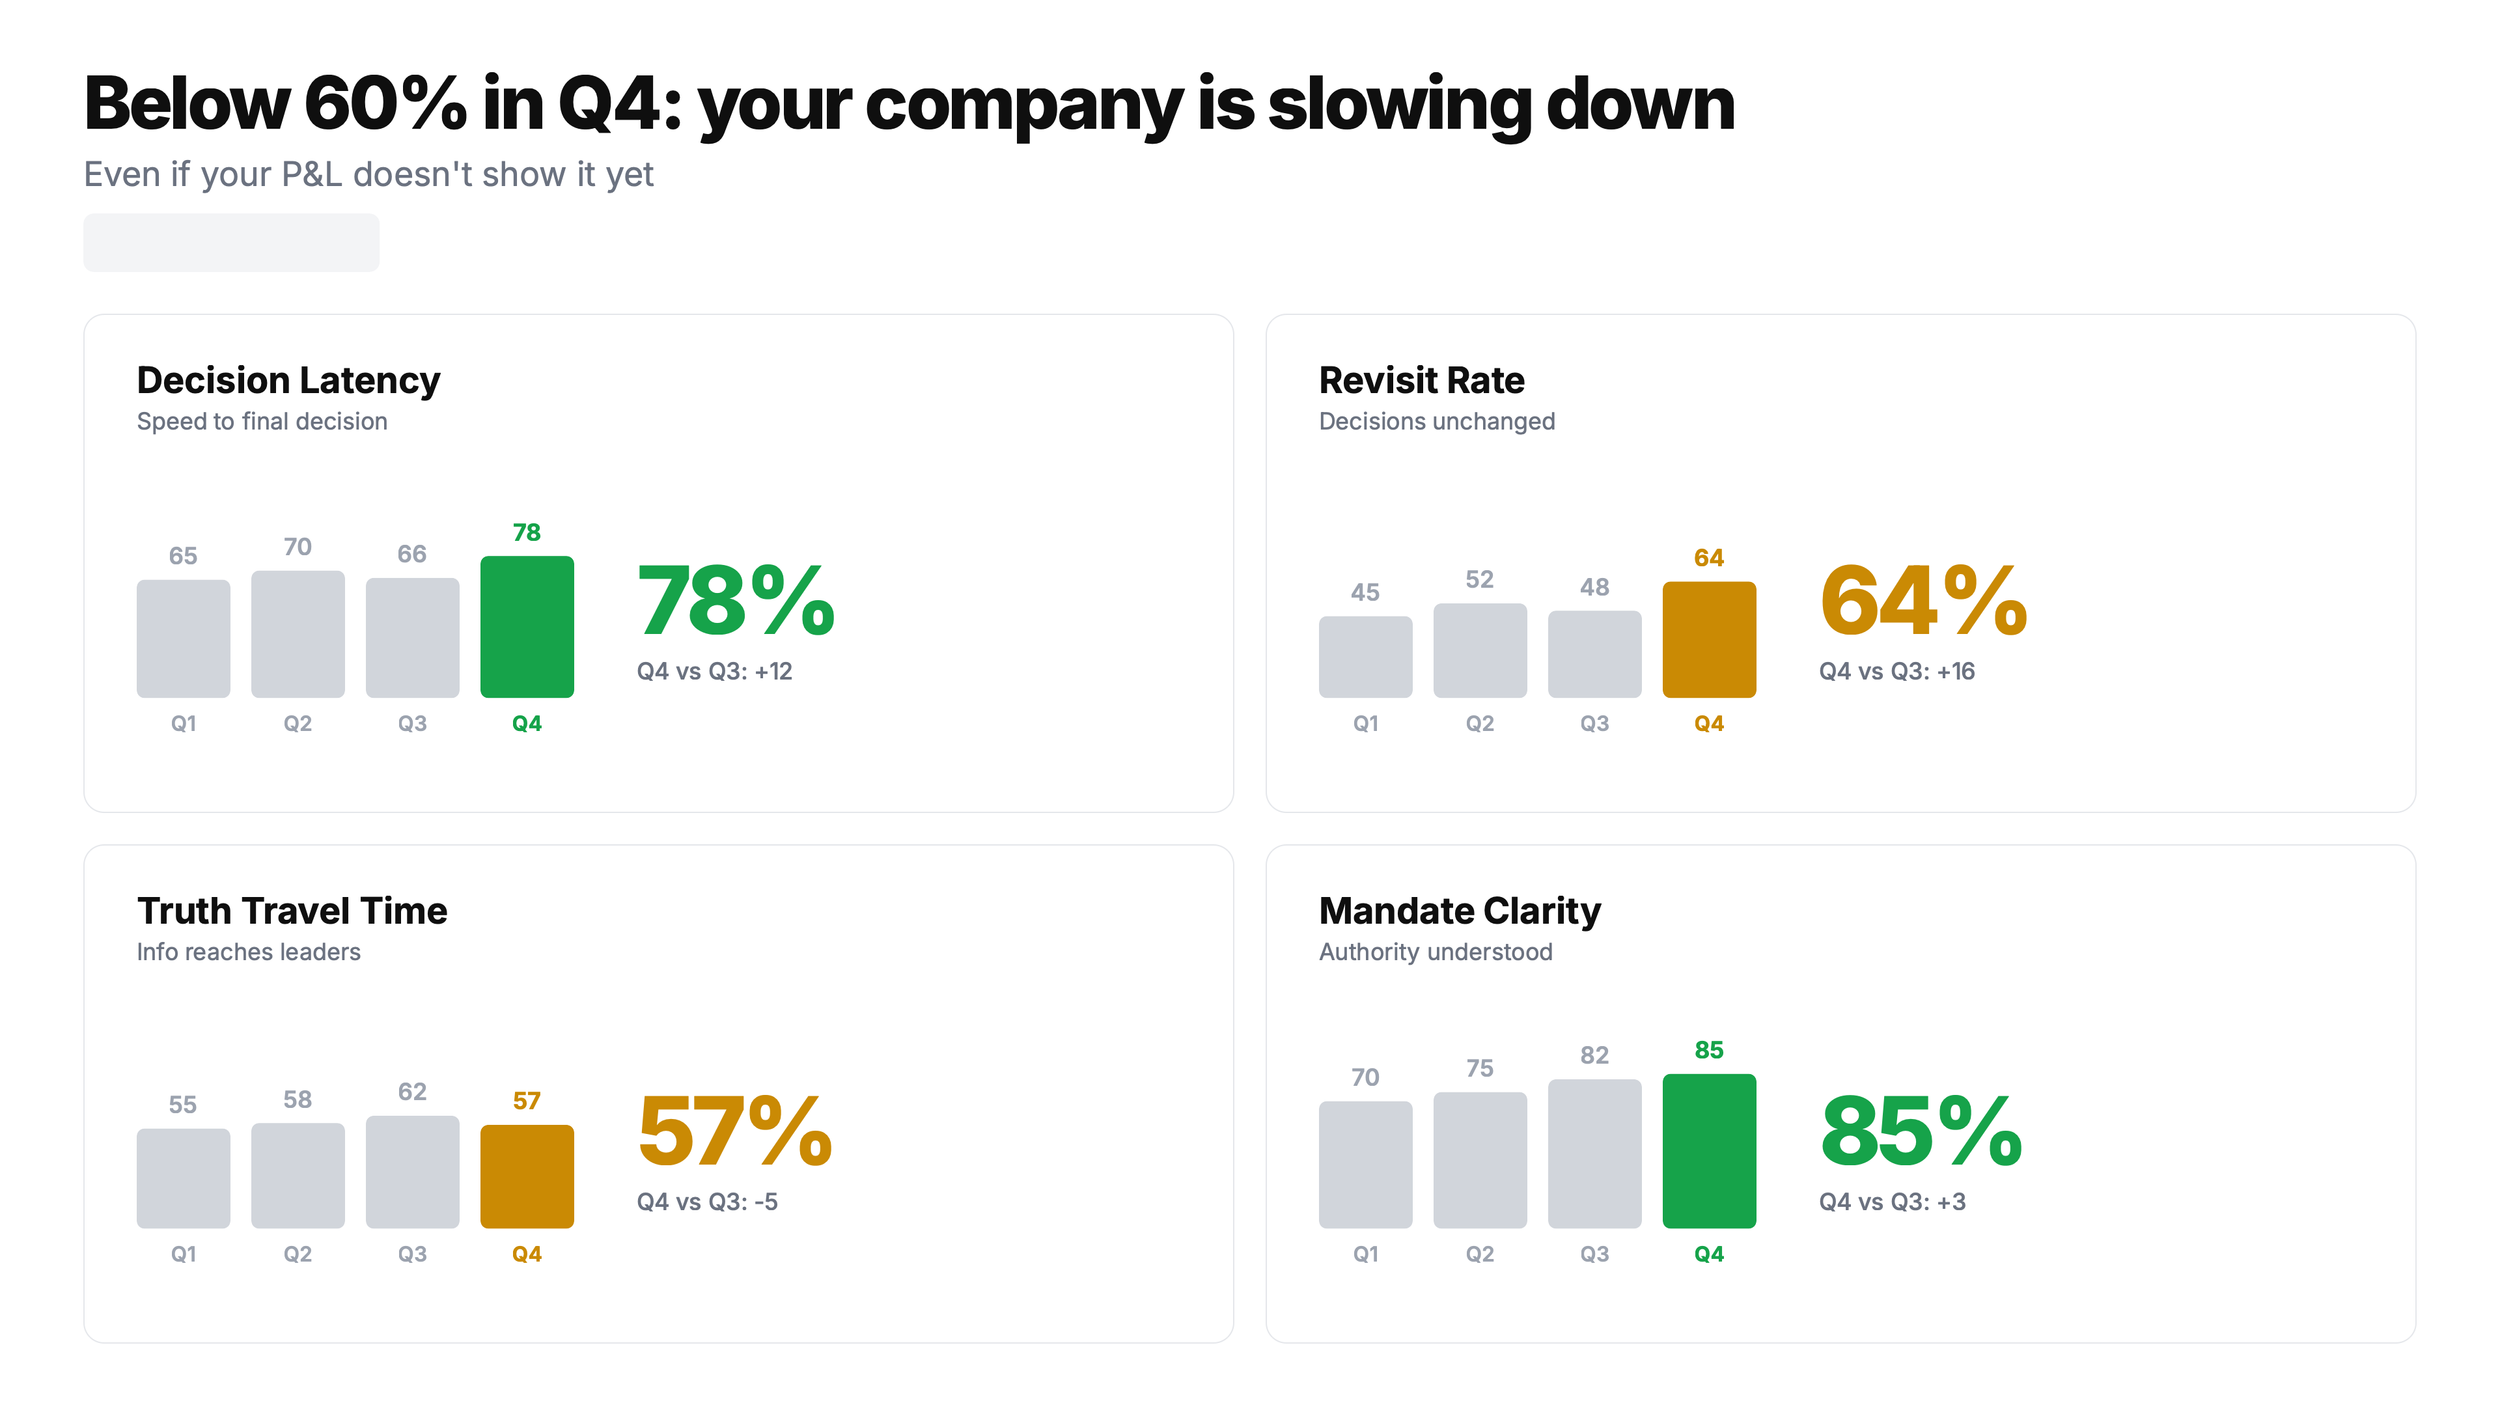
Below 60%: When Your Company Is Slowing Down
A score below 60 percent is an early warning. Execution slows, decisions drag, and risk builds long before it shows up in the numbers.
Four behavioural signals that show up 90 days before your P&L does.
A founder recently showed me his numbers, and they looked healthy. Revenue on plan. Pipeline green. Cash runway stable, all good.
Then he said something that did not match the numbers:
“I think we’re slowing down. I can’t just put my finger on exactly what and where to start”
He was right. The warning signs were there, subtle and not obvious. They were not yet showing in the P&L.
Here’s what’s going on:
Performance tells you what happened. The numbers are history. If you want to look into the crystal ball, you must start measuring your business behaviour.
This is the trap many SMEs are walking into.
Most companies measure outcomes, then reverse engineer a story and a conclusion to follow. Typically something like this:
When the quarter is good, the story is execution.
When the quarter is bad, the story is the market or product.
Behaviour sits underneath both stories. Behaviour is the mechanism.
I call it behaviour debt.
When behaviour changes for the worse, you get slower. You do not collapse immediately. And slow compounds.
What you can measure before the numbers move
You stop waiting for the P&L to give you permission to act.
You start measuring the stuff that moves before the numbers move: time, rework, silence, mandate fog, and decision delay.
I use four behavioural indicators because they show up early, they are observable, and they are hard to spin:
Decision latency: Time from “we need a decision” to “we have a decision people can execute.”
Revisit rate
Truth travel time
Mandate clarity
When decision time stretches, everything downstream dilutes. It quickly becomes the norm.
Hiring gets delayed.
Pricing gets delayed.
Product cuts get delayed.
Customer decisions get delayed.
The company starts living in hope.
That is the decision burn rate, the behavioural cousin of cash burn. Revisit rate is the frequency with which the same decision is returned.
A decision that returns twice was never a decision. It was a discussion with a calendar invite.
High revisit rate creates rot. People stay busy. Work expands. Accountability dissolves. Execution becomes optional.
The CEO gets the worst outcome of all.
Motion without progress becomes the norm.
Truth travel time: time from “someone knows” to “leadership knows” to “you know.”
This is a shadow metric.
In healthy companies, bad news moves fast. In distressed ones, it moves slowly. It gets filtered. It arrives packaged. Not because people are evil but because we’re human and often protect ourselves, and the narrative.
A mini office meeting test: Count how often you hear:
Who owns this
Can we do this
Do we have approval
Are we aligned
That language is data. It reveals whether your system is running on permission seeking, not execution.
Permission seeking feels safe, but it also kills speed.
The sentence I hear most often
Behaviour debt is rarely dramatic. It shows up as small frictions that keep repeating:
Decisions that take weeks, then get revisited anyway.
Projects that keep getting one more review
Meetings where everyone agrees and nothing changes
People are waiting for direction, then reworking when direction changes.
Bad news that arrives late, then arrives softened.
Leaders who say “we are aligned” while everyone is quietly hedging.
The sentence I hear most often after the fact is a classic:
“We thought we had more time.”
You almost never do.
I’ve watched this pattern destroy companies for 30 years. The data backs it up: organisations with high decision velocity show materially better growth and profitability. But you don’t need a consultant to tell you what you already feel in your board meetings.
So, behaviour measurement needs one rule: Measure behaviour to see reality.
Use it to remove friction, and not to reward speed.
The test is simple
Think of the last decision your board debated for more than two weeks.
Now ask:
Who actually owns it?
What happens if we wait 30 more days?
Who’s waiting for that decision to move?
If you can’t answer those cleanly, you’re not “gathering data.” You’re accumulating behaviour debt.
It will show up later as performance debt.
Where to start
If you want to start measuring business behaviour this week, start with one metric: Truth travel time.
Ask your team:
What is the worst thing we know right now?
Who knows it?
When did they know it?
When did I know it?
The gap between those two timestamps is your early warning signal.
Then stop talking. The first answer is usually polite. The second answer is usually true.
The fastest way to spot behaviour debt is to measure it.
Start with truth travel time: What’s the worst thing your team knows right now? When did they know it? When did you know it?
The gap between those two timestamps is your early warning signal.
If you want to start measuring this properly, here are my free tools:
Decision Latency Calculator: decisionlatency.earlywarningindex.com
Pre Mortem Generator: premortem.earlywarningindex.com
The €100,000 Week: What Slow Decisions Actually Cost
What decision delays actually cost, and a free calculator to measure yours.
What decision delays actually cost, and a free calculator to measure yours.
I told my board we needed to decide in two days. They said a week wouldn't matter. Three weeks later, that delay cost us 7 months, an extra funding round, and deals we'll never get back.
I call this the decision burn rate. And for most companies, it exceeds their monthly cash burn.
Every deferred decision accrues interest.
Delay replacing an underperforming sales leader by two quarters, and you've paid: lost revenue, cultural erosion (high performers leave when low performance is tolerated), and higher severance when the exit finally happens.
This is decision debt. It sits off your balance sheet but taxes every quarter.
The number your P&L never shows.
Most boards obsess over monthly cash burn. How fast are we spending?
But by the time cash gets tight, you've already lost. The real damage happened months earlier.
While you were in meetings, discussing, evaluating, getting "one more data point," the market moved. Competitors moved. Customers moved.
For a typical €2M revenue company, decision delays can cost €180,000 to €900,000 per year.
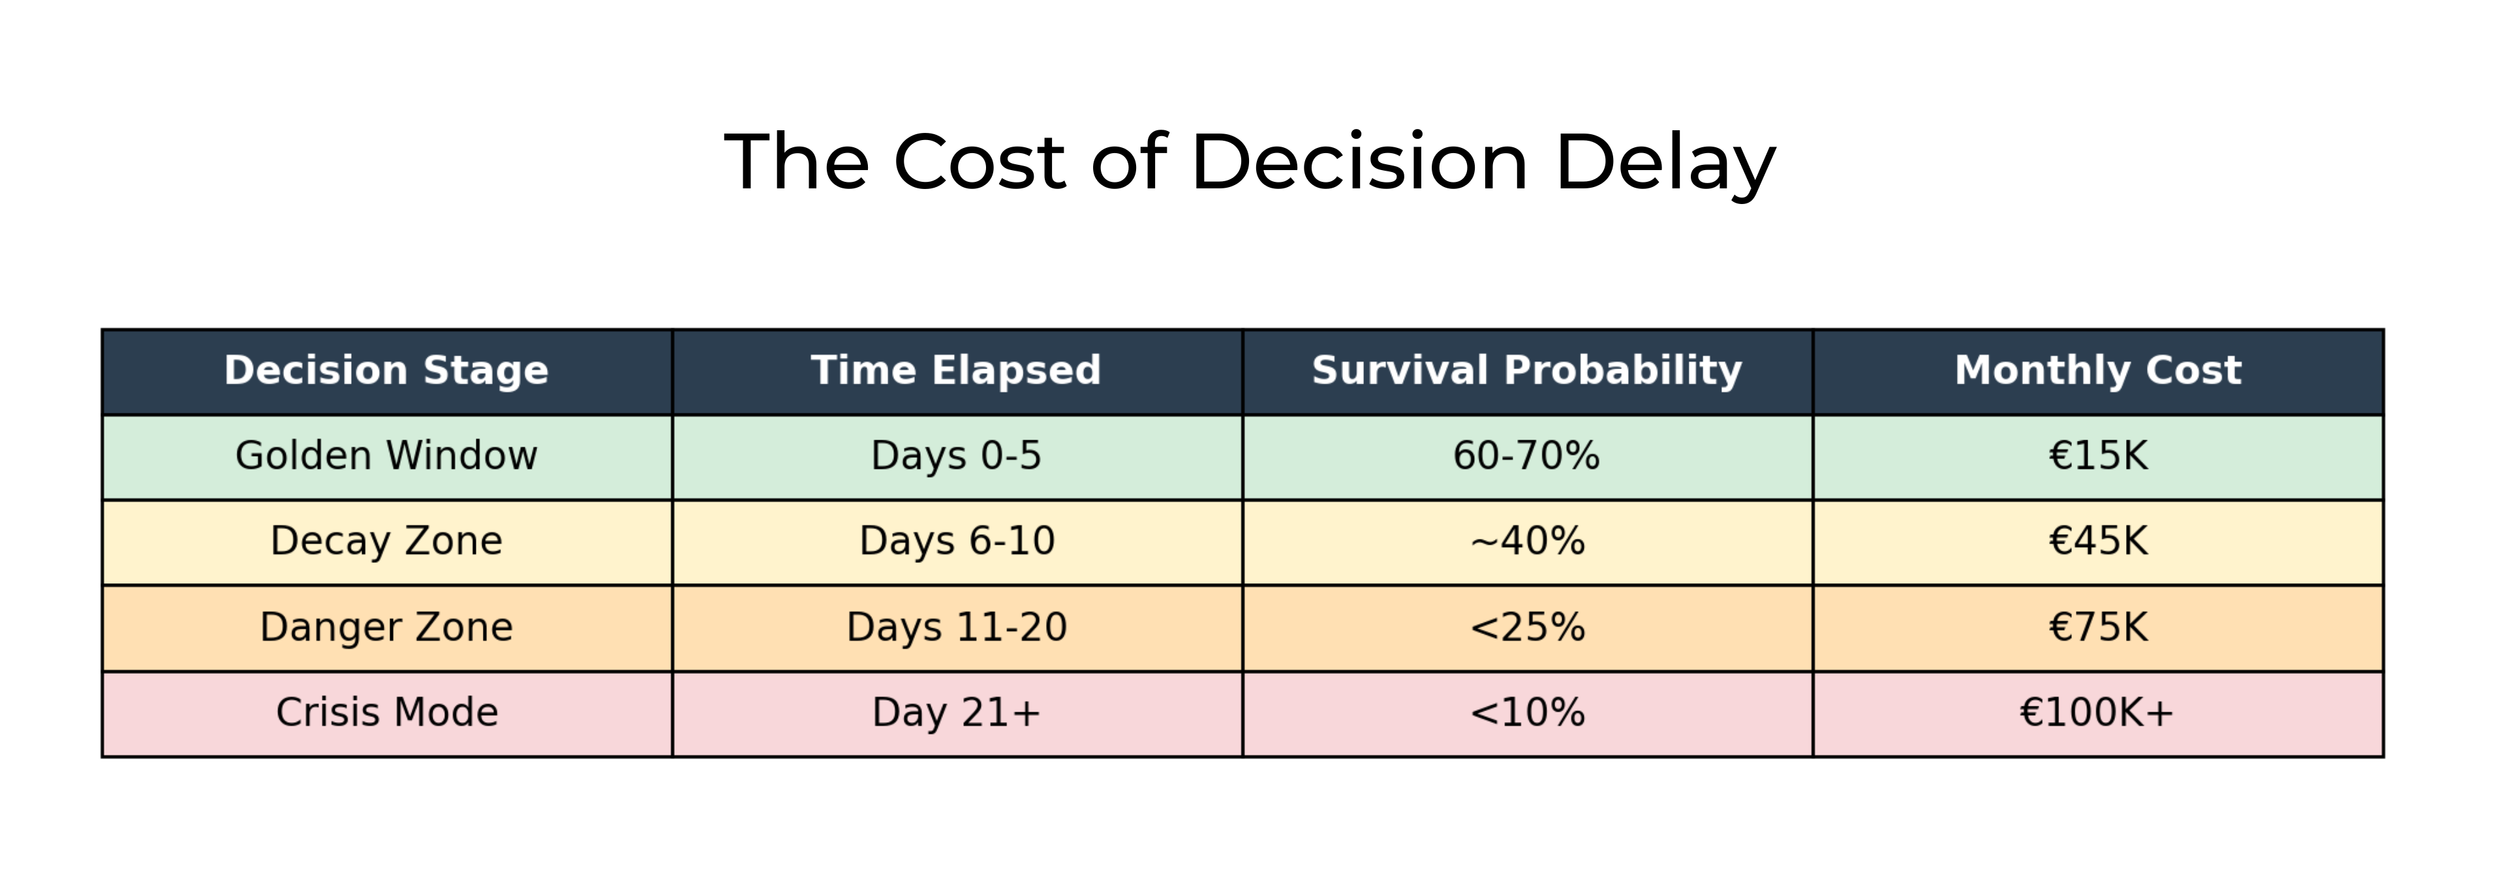
Tabel over Decision Latency hidden costs
There's no line in your financial statements for "revenue we would have captured if we'd moved six weeks faster."
But the cost is real.
Where it shows up
Decision delays aren't abstract. They show up as: • Deals lost to faster competitors • Product launches that miss market windows • Teams waiting for direction, then reworking when decisions finally change • Boards revisiting the same strategic questions quarter after quarter
The sentence I hear most often after the fact: "We thought we had more time."
You almost never do.
Why does this happen?
Pluralistic ignorance:
Director A thinks the forecast is delusional but stays silent to avoid seeming unsupportive.
Director B assumes Director A has a plan.
The founder projects confidence to keep investors happy.
Result: No one speaks. The motion passes. The company drifts closer to the cliff, not because anyone wanted it to, but because everyone was waiting for someone else to panic first.
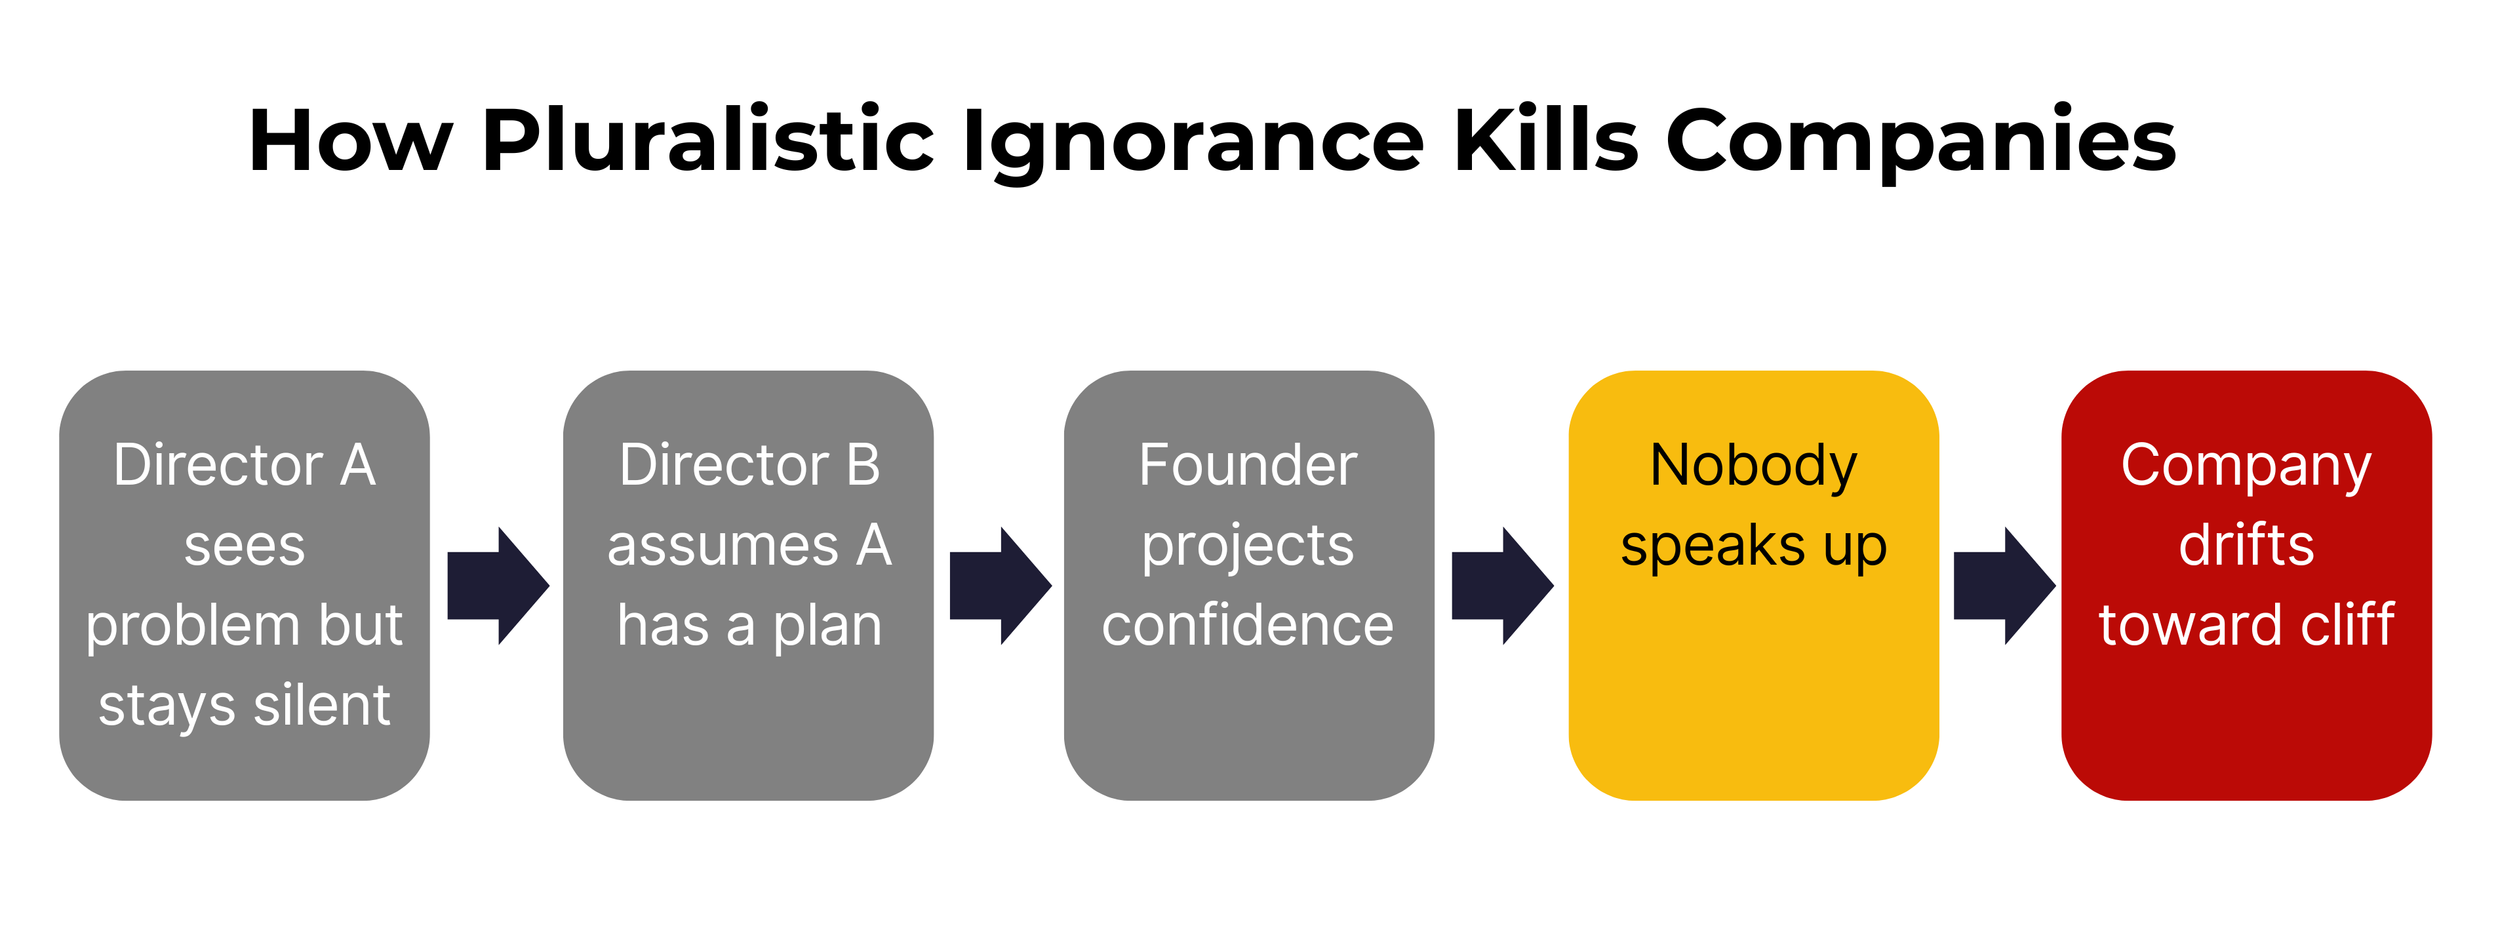
Pluralistic ignorance in one slide: everyone sees the problem, nobody says it, the company drifts
One shadow metric I track:
How fast bad news travels.
In healthy companies, bad news moves in hours. In distressed ones, it gets delayed, filtered, and buried in footnotes.
If your investor update used to arrive on the 5th and now shows up on the 15th—that's not a scheduling issue. That's distress.
This matters most for companies with revenue under €10M, where a slow call can shift the entire trajectory.
If you're past that stage with distributed decision-making, the dynamics change.
Why I built the Decision Latency Calculator
That board meeting was years ago. But I still see the same pattern every week in the startups, SMEs, and investors I work with.
So that is why I built a free Decision Latency Calculator.
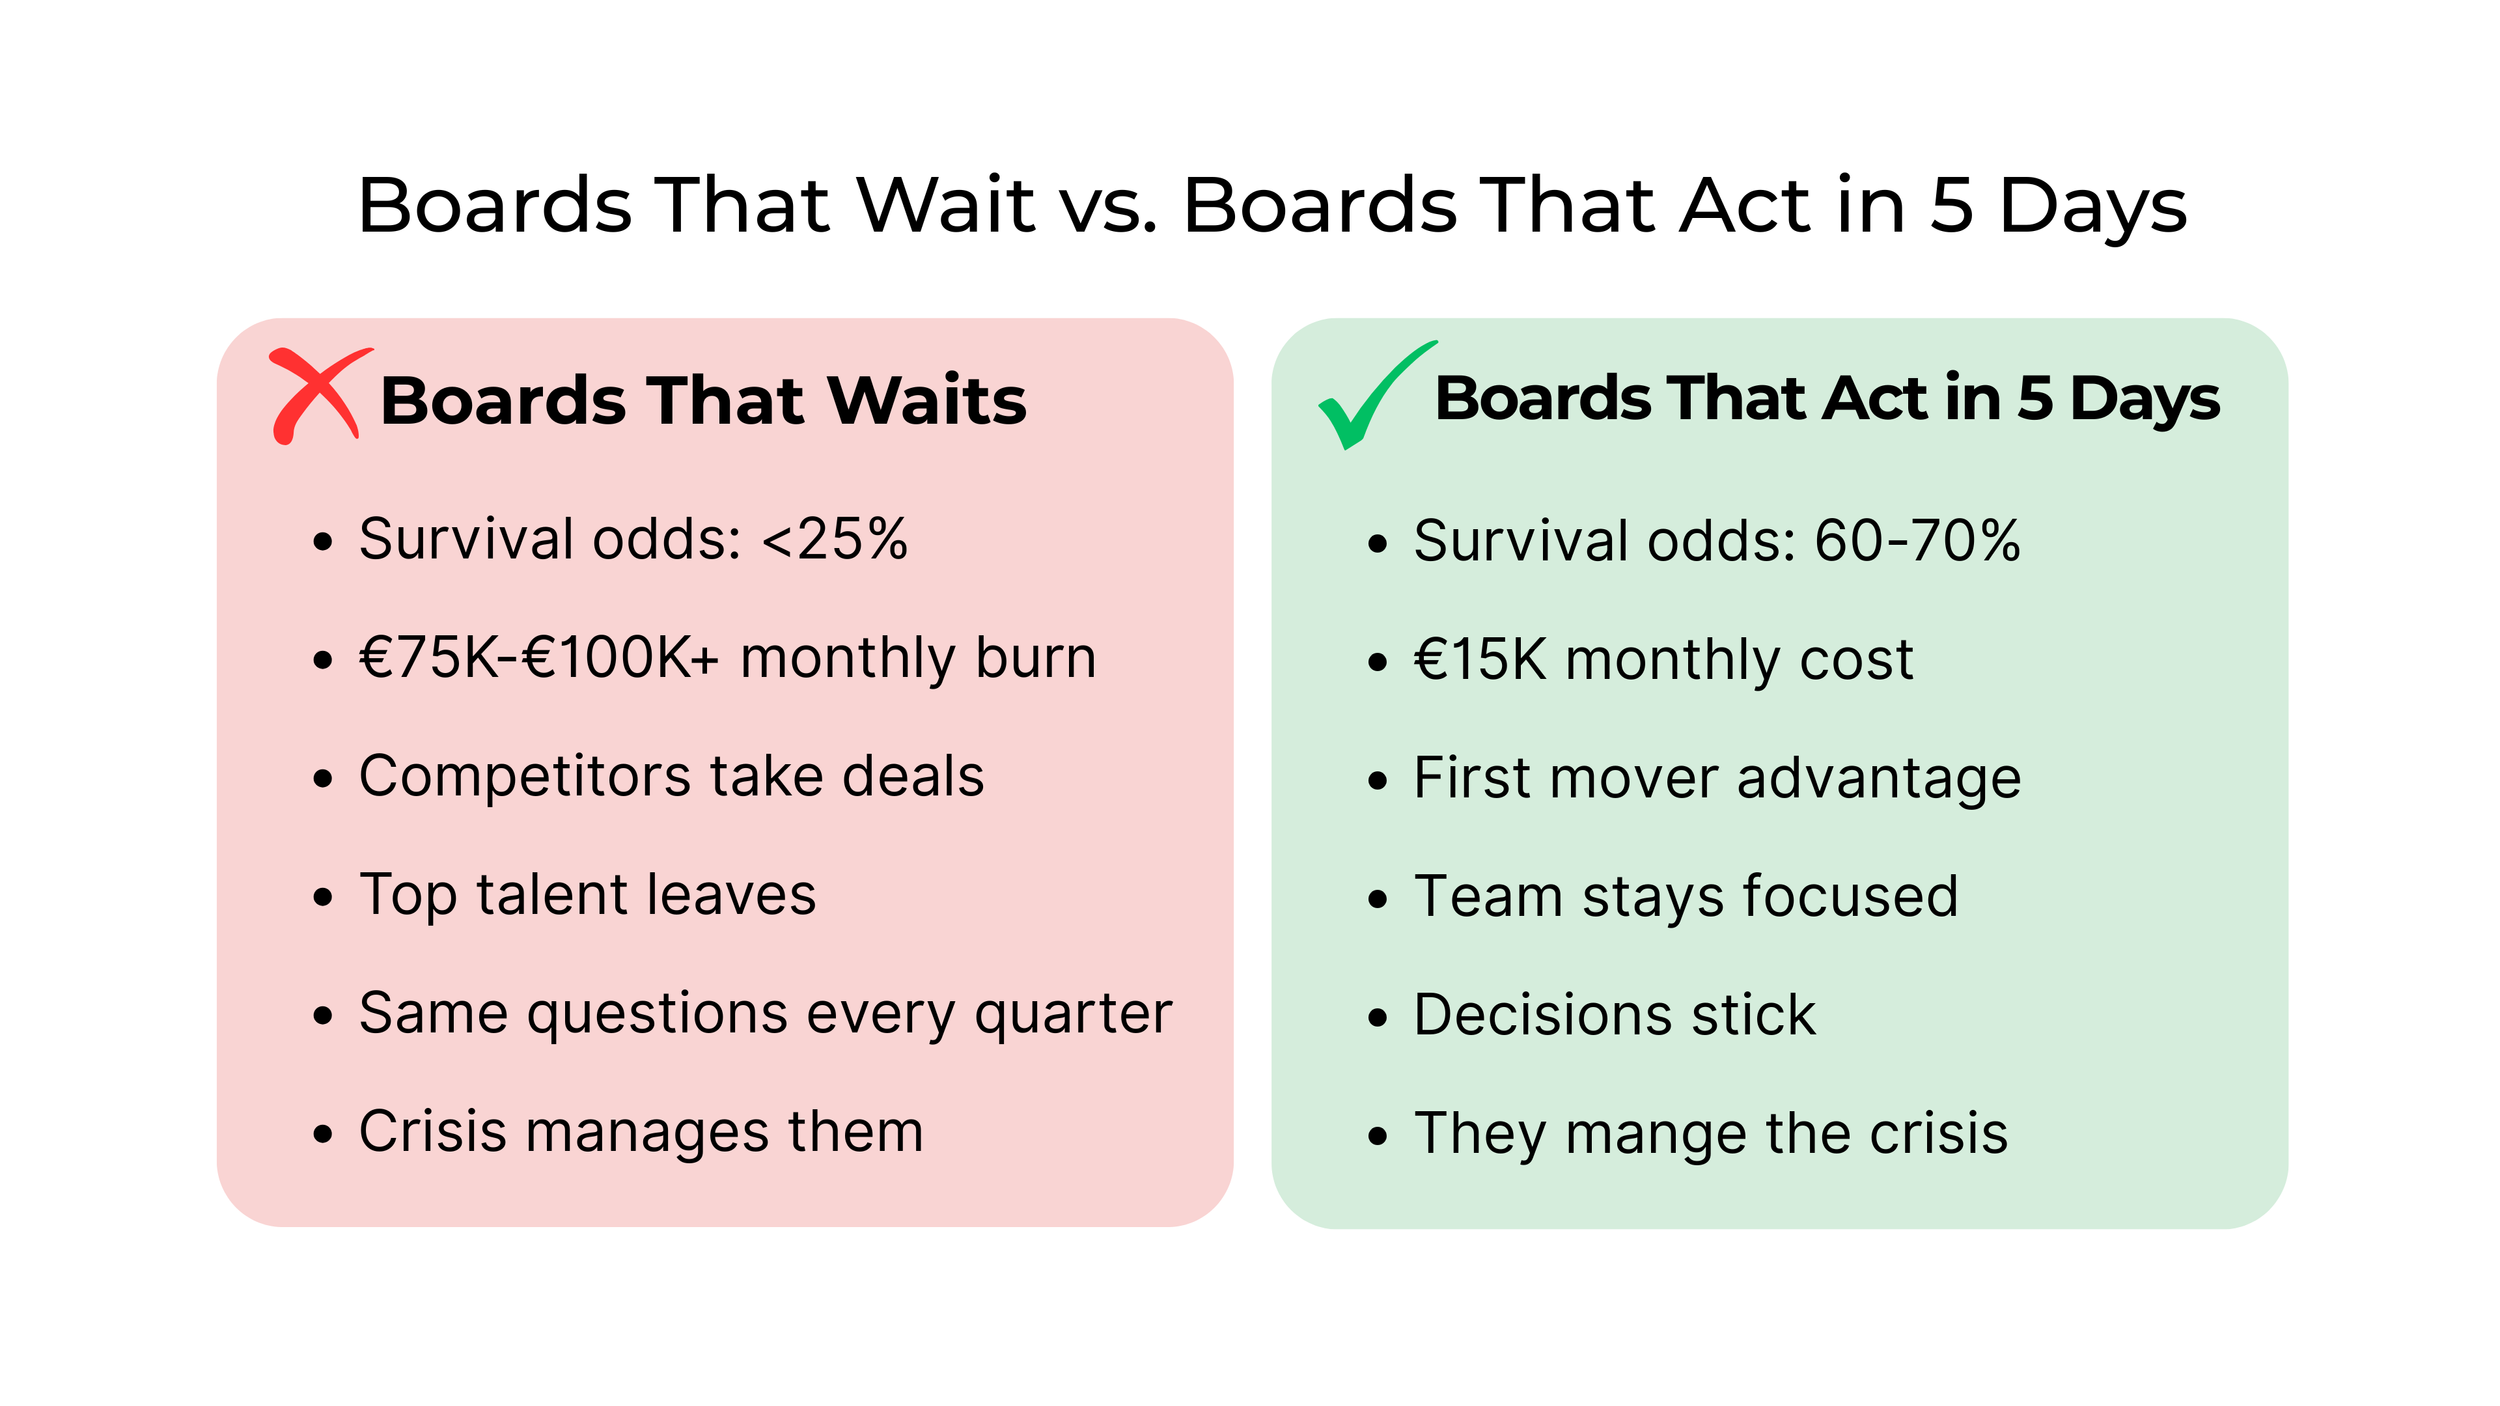
It's based on research that consistently shows that organizations that act within 5 days of recognizing a problem achieve survival rates of 60-70%.
Days 6-10? Survival drops to ~40%—boards are "gathering more data."
Past Day 10? Below 25%. At that point, you're not managing the crisis. The crisis is managing you.
You answer a short set of questions about how decisions actually happen in your company:
How long do they take?
How many people are involved?
How often do they get revisited?
What happens when conditions change?
You'll know: 1. Your actual decision speed—the number, not the feeling 2. The monthly cost in euros 3. Where decisions stall 4. Your survival odds if nothing changes
Takes a few minutes.
Your January board meeting
You know what needs to change.
You can show up and say: "We're working on it."
Or you can show up and say: "This is how long decisions actually take here. This is what the delay costs us per month. These are the bottlenecks."
One keeps the conversation vague. The other forces action.
The uncomfortable truth:
Optimism is a liability in a crisis. Your board's job isn't to be supportive, but skeptical.
Support often looks like enabling delusion. The most optimistic thing you can do is hunt for the pessimism hidden in your data.
The calculator is free: decisionlatency.earlywarningindex.com
Show up with numbers, not promises.
Send this to your CEO or board chair if decisions keep getting "one more review."
The Pre-Mortem Kill Switch
Most boards explain failure after it happens. A pre-mortem forces the conversation earlier. This newsletter explains how boards and investors use pre-mortems and kill switch criteria to surface failure risks before they get expensive.
The tool generates your failure scenario and Kill Switch checklist in under a minute.
Takeaway
Most business failures are explained clearly after the fact. Few are analysed seriously before decisions are locked in.
A pre-mortem helps boards and investors identify how a company could fail while there is still time to act.
Normalisation of deviance causes early warning signs to be ignored when performance still looks acceptable.
Written failure scenarios and explicit kill switch criteria turn vague concerns into concrete decision points.
The Pre-Mortem Generator is a free tool to support early risk detection and board level decision making.
The Pre-Mortem:
Most boards and investors are very good at one thing after a crisis:
Saying what went wrong.
Everyone can explain why it went wrong after the money is gone, the team is tired, and the customers have left.
Very few do the work before.
I built a free tool called the Pre-Mortem Generator at premortem.earlywarningindex.com. It writes a realistic “company obituary” and a Kill Switch checklist before you end up there.
When shortcuts become the standard
Normalisation of deviance is a heavy term for a simple thing:
- Small “rule breaks” slowly turn into normal practice.
What starts as “just this once” becomes “this is how we do it”.
You see it all the time.
Standards that were once strict get bent to hit a deadline.
Compliance rules are “interpreted” so a deal can close.
A board tolerates behaviour today that it would never have accepted two years ago.
There is no big decision to lower the bar.
People are busy. Targets are tight. Nobody wants to be the one who slows things down.
In risk research, this slow slide is called normalisation of deviance.
“We do not recognise that picture”
One of the first things I look for in potential future crises is how founders, management and investors talk about the company after 6, 12 or 24 months.
Do they describe the real problems in the same way?
Do they have the same idea of what is working and what is not?
Do they agree on what happens next if the plan fails?
When I walk investors and founders through that picture, most of them say the same thing:
“That is not us.”
“We do not recognise that.”
Then we look at the facts:
90% of businesses eventually fail.
75% of investments never return any capital
80% of us are overestimating our own and the business's capabilities.
I can go on, anyway, on paper, everyone knows this.
In the room, however, most still behave as if they will be the exception.
The problem is rarely a lack of intelligence or effort, but the refusal to look at the situation with clear eyes and accept the consequences.
Post-mortems are cheap wisdom bought at a high price.
I first learned it in sales.
We did post-mortems on lost deals. We looked at what went wrong and what we should do differently next time.
At some point, we flipped the question.
Before big deals, we asked:
“If we lose this, why will we lose it?” Identify red flags.
A somewhat weird but very useful exercise. We could still change the outcome.
The same logic applies to companies, not only deals.
Boards are full of smart people who are willing to sit for hours in a post-mortem.
Very few spend ten quiet minutes on a simple pre-mortem.
That is the gap I wanted to close when I built the Pre-Mortem Generator.
What the Pre-Mortem Generator does
The Pre-Mortem Generator is built for angels, VCs, board members and founders.
You answer a short set of questions about:
- the company stage
- current cash flow and runway
- the main risks you see
- any major change in strategy or spending you are considering
Based on that, the tool gives you two things.
1) First, a written failure scenario:
A “company obituary” that describes how the company could realistically end up in trouble if you continue on the current path.
2) Second, a kill switch checklist:
Concrete criteria that tell you when to pause, slow down or stop.
For example, triggers around customer loss, hiring, cash, dependency on single people, or regulatory issues.
It takes a few minutes to fill out.
You get a text you can read yourself, share with the founder, or bring straight into the next board or investment meeting.
The method behind it comes from Gary Klein’s work on pre-mortems and Diane Vaughan’s work on normalisation of deviance, but the output is written in plain language for everyday use.
The real resistance
The main barrier is not time but emotions.
Typical thoughts:
“If this report looks bad, it will reflect on me as an investor or leader.”
“The management is already under pressure. I do not want to worry them more.”
“We already know our risks. A tool will not tell us anything new.”
I understand that. I have sat in those rooms and had the same thoughts.
But if the goal is to protect capital, jobs and reputation, then not looking is the most expensive choice you can make.
Businesses using external early detection are 76% more likely to succeed.
A tool like this does not care whose idea it was or who sits on which side of the table. It just mirrors what you put in and forces a reaction.
Sometimes the “worst” outcome is that the report confirms what you already knew.
Then at least the conversation is based on something written and specific, not on vague feelings and optimism.
How to use it
A few simple ways angels, VCs and boards use the Pre Mortem Generator:
Before signing off on a major change to a product, market, or spending.
Before putting more money into a company where something feels off.
As a quarterly “fire drill” on the most important portfolio companies.
As a neutral starting point, when founders and boards do not agree on how serious the situation is.
Run it individually first. Then share it with your board, founder, etc.
The gaps between what people notice are often more important than the report itself.
The Early Warning Index examines behaviour, decisions, and financials here and now and over time.
The Pre-Mortem Generator examines where those patterns could lead if no one changes course.
Try it and tell me what surprised you.
The tool is free to use.
It is available in Danish and English at premortem.earlywarningindex.com.
Disclaimer:
The failure scenarios are hypothetical.
They are not predictions.
They are written to help you see patterns and consequences from another angle.
If you run it on a company or an investment, I am curious about two things:
- What in the “company obituary” felt uncomfortably close to home
- Which kill switch trigger did you decide to watch from now on
You can write to me or comment with what you can share.
Post-mortems will always be written.
The question is: how many of them could you have avoided with a short pre-mortem?
The Psychology Behind Recovery: Why Founders Break, and Come Back
Last time, we looked at why investors keep accepting 90 percent failure as inevitable.
This time, we need to go inside the companies that make up those numbers and meet the people holding them together.
When the Numbers Stop Helping
Every turnaround begins with data.
But the moment you enter a boardroom in crisis, the spreadsheets lose authority.
You can sense it: the founder who keeps saying “We’re close” when everyone else has stopped believing.
The product is flat, cash is thin, and yet confidence sounds higher than ever. There can be several reasons for this phenomenon, but most often:
Inattentional blindness: leadership so focused on proving progress that it literally can’t see the evidence of decline right in front of it.
Illusory Superiority: when founders genuinely believe they’re outperforming despite data proving otherwise
I’ve seen this many times.
Not because founders are delusional, but because they’ve built the company as an extension of themselves.
When the business starts to collapse, so does their sense of identity.
That emotional fusion is rarely visible in financial reports, but it explains why so many recoveries fail before they even start.
What the Data Reveals
Across studies of founder psychology, a consistent pattern emerges:
Lower neuroticism correlates with 16 percent higher exit success.
Higher conscientiousness yields roughly $90,000 in extra early-stage funding.
Diverse founder teams show markedly higher success rates.
First-time founders succeed 18 percent of the time; repeat founders 20–30 percent.
“Repeat successful” founders reach 30 percent, meaning seven out of ten still fail.
Underneath those statistics lies a simple truth: most outcomes stem from behavior under pressure.
According to Mindspace’s 2025 Founder Resilience Report, 76 percent of startup founders now report symptoms of burnout, and 58 percent have considered stepping down due to mental exhaustion.
The same traits that fuel creativity (intensity, perfectionism, obsessive focus) become liabilities when uncertainty turns chronic.
The line between resilience and rigidity is thinner than most boards realize.
Where Recovery Breaks Down
In every turnaround I’ve been involved in, the real decline didn’t start with market shifts or competitors.
It started when leadership psychology cracked.
Founders delayed pivots because changing direction felt like betrayal.
Boards avoided confrontation because honesty felt too risky.
Everyone waited for certainty — when what they needed was courage.
Ego and fear erode decision speed long before liquidity disappears.
And once decision velocity slows, trust follows.
I call it emotional liquidity, the organization’s capacity to move fast without panic.
When that dries up, even the best financial injection won’t help.
What the Survivors Do Differently
The difference between collapse and comeback is behavioural.
Founders who recover fastest share one quality: psychological readiness.
They can separate personal worth from company worth.
They see a crisis not as identity failure but as a solvable system problem.
Across recovery cases, five resilience factors repeat:
Structured mental-health routines — therapy, exercise, disciplined rest.
Diverse teams — cognitive range prevents groupthink.
Early pivots — one or two pivots improve user growth 3.6× on average.
Support networks — peers who normalize crisis realism.
Learning from failure — experience compounds faster than capital.
These leaders act sooner and communicate clearly because they aren’t defending their ego, but their mission.
The Recovery Odds Index™ View
In the Recovery Odds Index framework, these behaviors map directly across three of the six engines:
Leadership (clarity under pressure).
Decision Velocity (speed without distortion).
Trust (transparent dialogue between founder, board, and investors).
When any one of these engines stalls, the recovery probability falls sharply well before insolvency.
That’s why the diagnostic begins not with cash flow, but with cognitive flow.
If confidence rises while performance falls, you’re watching denial form in real time.
What Boards and Investors Can Do
Boards often track burn rate to the decimal but ignore the human indicators that predict it.
A few simple checks can change outcomes entirely:
Run a quarterly trust pulse. Two anonymous questions reveal alignment drift faster than any strategy memo.
Add a Recovery Readiness Check to every board pack. Treat it as operational due diligence, not an HR exercise.
Reward course correction, not confidence. Celebrate founders who pivot early — they’re protecting value, not abandoning vision.
These are low-cost interventions. Ignoring them is expensive.
The 30 Percent Reality
Turnaround success rates hover between 10 and 30 percent worldwide.
That sounds bleak until you realize what unites those who make it.
They are not the ones with the best plans, but the ones most willing to rewrite them.
They build cultures where saying “I don’t know” is a strength signal, not a weakness.
And they measure trust as carefully as they measure cash.
In the end, resilience is less about toughness and more about flexibility.
Rigid leaders shatter; adaptive ones bend and rebuild.
A Shift in Perspective
The deeper lesson for boards and investors is this:
Founders are not just executing business models, but managing identity systems under stress.
Supporting that process isn’t “soft.”
It’s risk mitigation.
The cost of ignoring founder psychology is measured in valuation write-offs and lost optionality.
The Moral
Recovery begins the moment a founder stops proving they’re right and starts proving they can adapt.
What does adaptability look like in your world?
Crisis Management: How to Regain Control When Everything Feels Out of Control
Crises expose the difference between organizations that react and those that recover. From economic shocks to leadership breakdowns, this guide shows how to assess your readiness, build resilience, and act before the next disruption hits.
Every CEO has felt it — that stomach-dropping moment when you realize your business faces a crisis that could end everything you've built. Supply chains collapse overnight. Key customers vanish. Economic downturns hit without warning. Leadership changes create chaos. The harsh reality? Sixty percent of business turnarounds still fail, despite having smart leadership and strong foundations.
The difference between companies that survive crises and those that don't isn't luck or resources alone. It comes down to one critical factor: crisis management readiness. Not just having cash reserves or experienced leadership, but building comprehensive systems that keep your business operational when everything else falls apart.
This guide will walk you through the essential elements of crisis management, from identifying vulnerabilities before they become fatal to implementing response strategies that protect your stakeholder value when pressure mounts.
Why Crisis Readiness Separates Survivors from Casualties
Crisis management isn't optional preparation — it's business insurance that pays dividends when disaster strikes. Companies with robust crisis management systems don't just survive disruptions; they often emerge stronger than competitors who weren't prepared.
The most successful crisis management strategies address one fundamental truth: crises amplify existing weaknesses. A company with poor cash flow management will collapse faster during economic downturns. Organizations with weak leadership structures will fragment under pressure. Businesses with concentrated customer bases face immediate threats when major clients disappear.
Financial resilience forms the foundation of crisis survival. This goes beyond maintaining cash reserves — it includes debt structure optimization, revenue diversification, and cost flexibility. Companies with multiple revenue streams and variable cost structures navigate downturns more effectively than those dependent on single income sources or fixed expenses.
Operational redundancy prevents single points of failure from destroying your business. Supply chain disruptions, technology breakdowns, or production issues can cascade quickly across multiple business functions. The companies that survive have backup systems, alternative suppliers, and process redundancies built into their operations.
Leadership alignment becomes critical when rapid decisions determine survival outcomes. Boards and executive teams that haven't practiced crisis scenarios often make fatal mistakes under pressure. Regular crisis simulations and clear decision-making protocols ensure leadership can respond swiftly and effectively.
Stakeholder communication protects relationships that keep businesses alive during tough periods. Investors, customers, suppliers, and employees need honest, timely updates during crises. Companies with strong communication protocols maintain trust and support when they need it most.
Understanding the Crisis Landscape Your Business Faces
Effective crisis management requires understanding the full spectrum of threats your business might encounter. Each crisis type demands different preparation strategies, and the most dangerous situations involve multiple crisis types occurring simultaneously.
Economic crises
Hit through market downturns, inflation spikes, or credit crunches. These external shocks affect cash flow, customer demand, and capital access. Companies with strong financial planning and diverse revenue streams typically weather economic turbulence better than those with concentrated income sources or high debt loads.
Operational crises
Emerge from internal failures: supply chain disruptions, technology breakdowns, or production issues. These situations often cascade quickly, affecting multiple business functions simultaneously. Robust risk management and contingency planning provide essential protection against operational vulnerabilities.
Reputational crises
Stems from public relations disasters, ethical violations, or customer service failures. Reputational damage spreads rapidly and can destroy decades of brand building within days. Clear communication protocols and stakeholder management strategies offer crucial protection against reputation threats.
Leadership crises
It occurs when key executives leave, boards become dysfunctional, or strategic direction becomes unclear. These internal disruptions create uncertainty that affects employee morale, investor confidence, and operational effectiveness. Strong governance structures and succession planning help maintain stability during leadership transitions.
Regulatory and legal crises
Arises from compliance failures, lawsuits, or changing regulations. These situations require immediate legal response while maintaining business operations. Companies with proactive compliance programs and legal risk assessments navigate these challenges more effectively.
Building Your Crisis Management Framework
A comprehensive crisis management plan addresses potential vulnerabilities before they become fatal weaknesses. The most effective approaches examine multiple dimensions of business resilience and create specific response protocols for different scenarios.
Assessment and early warning systems help identify brewing problems before they become full crises. Regular financial health checks, operational risk assessments, and stakeholder feedback monitoring provide early indicators of potential issues. Companies using systematic assessment tools catch problems earlier and respond more effectively.
Response team structure ensures clear roles and responsibilities during crises. Designate specific team members for different crisis types, establish communication chains, and define decision-making authority levels. Practice these structures regularly through crisis simulations to build muscle memory for high-pressure situations.
Communication strategies maintain stakeholder confidence during turbulent periods. Develop templates for different crisis scenarios, establish communication timelines, and designate official spokespersons. Honest, timely communication builds trust and maintains relationships that support business survival.
Financial contingency planning provides resources and options when revenue drops or costs spike. Maintain diverse funding sources, establish credit facilities before you need them, and identify cost reduction opportunities that preserve core capabilities. Financial flexibility often determines which companies survive prolonged crises.
Operational backup systems prevent single points of failure from shutting down critical business functions. Document key processes, cross-train employees, maintain supplier alternatives, and invest in technology redundancy. These preparations allow continued operations even when primary systems fail.
Learning from Crisis Management Success Stories
Real-world examples demonstrate how effective crisis management separates surviving companies from failed competitors. These case studies reveal common patterns among companies that navigate crises successfully.
Johnson & Johnson's Tylenol crisis in 1982 shows how transparent communication and decisive action can protect brand reputation during product safety crises. The company immediately recalled products, communicated openly with media and customers, and implemented new safety measures. This response actually strengthened customer trust despite the initial crisis.
Southwest Airlines' operational resilience during various industry disruptions demonstrates the value of operational redundancy and employee engagement. The company's flexible cost structure, cross-trained workforce, and strong company culture help it maintain operations when competitors struggle with disruptions.
Small business recovery examples show how local companies use crisis management principles to survive economic downturns. Restaurants that pivoted to delivery models, retailers that moved online, and service businesses that adapted their offerings demonstrate how crisis management enables business model evolution.
These success stories share common elements: early problem recognition, clear communication, decisive action, and stakeholder engagement. Companies that prepare for these elements before crises hit perform better than those that try to figure it out under pressure.
Tools and Resources for Crisis Management Excellence
Modern crisis management benefits from systematic tools and resources that support assessment, planning, and execution. The most effective approaches combine assessment frameworks, planning templates, and ongoing monitoring systems.
Professional crisis management assessments provide objective analysis of business vulnerabilities and readiness levels. Tools like the Turnaround Readiness Assessment examine 42 critical factors that determine survival odds during business crises. These comprehensive evaluations identify specific areas requiring attention and provide priority rankings for improvement efforts.
Crisis simulation exercises help leadership teams practice decision-making under pressure. Regular scenario planning sessions allow teams to work through different crisis types, test communication protocols, and refine response strategies. These practice sessions build confidence and competence for real crises.
Industry-specific resources provide targeted guidance for particular business sectors. Manufacturing companies face different crisis risks than service businesses or technology firms. Sector-specific crisis management frameworks address the unique vulnerabilities and response requirements for different industries.
Professional crisis management support offers expert guidance when internal resources aren't sufficient. Crisis management consultants provide objective assessment, specialized expertise, and additional leadership capacity during high-pressure situations. Having established relationships with crisis management professionals before you need them ensures a rapid response when crises hit.
Transform Crisis Risk into Competitive Advantage
Crisis management excellence doesn't just protect your business — it creates competitive advantages that compound over time. Companies with robust crisis management systems make faster decisions, maintain stakeholder confidence, and adapt more quickly to changing conditions.
The businesses that thrive long-term view crisis management as a strategic investment rather than a defensive cost. They build resilience into their operations, develop leadership capabilities that handle uncertainty, and create stakeholder relationships that support them through difficult periods.
Start your crisis management journey with an honest assessment of your current readiness level. Identify the specific vulnerabilities that pose the greatest threats to your business survival. Develop response protocols for your highest-risk scenarios. Practice these responses regularly to build organizational competence.
Remember, crisis management readiness isn't about predicting the future — it's about building capabilities that help you respond effectively regardless of what challenges emerge. The companies that invest in crisis management today will be the ones still standing when the next economic storm passes.